Youth baseball built an incredible development system. Somewhere along the way, it weakened the participation system around it. Look at Michigan across a quarter century and a contradiction jumps off the page.
There are more teams than ever. More tournaments. More private training, more indoor facilities, more rankings. Families are spending more than at any point on record. And yet, when those kids reach high school, fewer of them are still playing.
MHSAA Bulletin, Aug. 2001MHSAA 2025–26TPX RankingsProject Play
In 2000–01, MHSAA schools reported 19,351 baseball players across 625 programs. In 2025–26, 15,685 across 643. Program count held steady; the players didn't. That's the equivalent of losing every player from roughly 150 of today's high-school rosters.
Travel baseball isn't the villain.
A development engine that works for the players it was built for.
Strong players need strong competition. Families want good coaching. Kids want more baseball. Tournament baseball provides opportunities community programs sometimes cannot — and nothing in this report argues otherwise.
The problem isn't that travel baseball exists. The question is something else entirely.
Kids haven't stopped loving baseball
If baseball were simply falling out of fashion, you'd expect every measure to be falling. The opposite is happening. Casual baseball — people playing at least once a year, in the backyard, at a clinic, in a pickup game or a rec season — is at an all-time high. Total U.S. baseball participation hit 17.3 million in 2024, the highest level the Sports & Fitness Industry Association has recorded.
MLB / SFIA, 2024SFIA 2025 Topline via Formula4 Media
Casual play is booming. Regular play is not.
At the same time, regular participation — kids playing often enough to actually develop — is shrinking. Among ages 6–12, regular baseball participation fell 19% from 2019 to 2024. The share of kids playing baseball regularly slipped from 11.3% in 2014 to 10.2% in 2024.
Project Play, 2025Project Play data via Sports Planning Guide
That split is the whole story in miniature. Kids and families still want baseball. More of them are trying it than ever. What's disappearing is the step after trying it: a regular, affordable, well-coached way to keep playing that isn't a full travel commitment. Casual demand is growing at one end, elite supply is growing at the other — and the middle, where casual players become real players, is where the system is thinning out.
The middle disappeared.
The rung between rec and travel — competitive, local, well-coached baseball — has quietly thinned out.
For a generation, the pathway worked like a ladder. Kids started in community baseball, moved up to competitive local baseball as they got better, and the best players went on to travel and elite teams. Increasingly, that ladder has become a fork.
The pathway, then and now
Aspen Institute's Project Play has independently identified the weakening of in-town leagues and the movement of families toward travel programs — including specifically in Southeast Michigan. Its recommendation: revitalize in-town leagues and give families reasons not to leave early for travel teams.
State of Play: Southeast MichiganProject Play SE Michigan
Not every kid needs rec baseball. Not every kid needs a $3,000–$10,000 travel experience. A huge population simply wants better coaching, meaningful development, competitive games, reliable scheduling, good fields, trained umpires — and local baseball. That's the population the current binary underserves.
Baseball became a business.
What families pay for — and who they pay — has changed.
Project Play's parent survey found baseball families outspent soccer and basketball families on registration, travel and lodging, lessons, and camps. Overall youth-sports spending rose 46% over the same period; baseball rose 68%.
Businesses aren't inherently the problem. Tournament operators provide tournaments. Trainers provide instruction. Facilities provide year-round access. The issue is the cumulative system.
Where the money goes
- Field
- Umpires
- Baseballs
- Team equipment
Shared costs, split across a roster. The fee paid for a place to play and someone to call the game.
| Team duesMedian travel-ball team fee; often includes indoor winter training | $2,000 |
| Tournament travelMostly day trips in Michigan; 1–2 overnight weekends for hotel, gas & food | $800 |
| Private lessons20 sessions × $50 | $1,000 |
| Bat & personal gear | $1,000 |
| Camps & showcases | $400 |
| Uniform package | $250 |
| Apps, streaming & tech | $100 |
| Example seasonIllustrative total, not survey data | $5,550 |
Team dues reflect the median from a Bat Digest survey of ~700 baseball parents. Other line items, and the $5,550 season total, are illustrative examples of a typical Michigan 8U–12U competitive season, not survey data. Actual costs vary widely by team, age group and family.
We built more baseball around each player. We didn't necessarily build more baseball players.
The funnel gets wider through 12U. Then high school gets thinner.
More travel teams at 12U. Fewer players by high school.
Put the two ends of Michigan youth baseball side by side and the shape of the problem appears. The competitive travel system is at its largest at 12U, the last age before kids move to the big field. The high-school game waiting on the other side is smaller than it was 25 years ago.
Two ends of the same pathway
Different measures, different kids, different years. The left panel counts teams in 2026; the right counts high-school players across two school years. We don't present this as one cohort being tracked — the contrast is in the shape: growth all the way through 12U, decline at the high-school level.
TPX Rankings · Farm League countMHSAA Bulletin, Aug. 2001MHSAA 2025–26
The widening: travel by age
Michigan TPX-ranked travel teams, 2026
TPX Rankings · Farm League count
We aren't following the same cohort, so we don't claim to track individual kids. But the pattern is strongly consistent with progressive entry into travel as children age — exactly the years when community baseball struggles most to keep its competitive players.
The thinning: high school
If schools had simply stopped offering baseball, the decline would be easy to explain. They haven't. Michigan has more high-school baseball programs today than it did in 2000–01.
Michigan high-school baseball participants, every year since 2000–01
2018–19 figure (17,211) from MHSAA's year-end totals as published by MLive; MHSAA's own 2018–19 file is mislabeled in its archive. 2019–20 and 2020–21 were affected by COVID-19: the 2020 spring season was canceled, and counts reflect players who had registered or begun practice. Even excluding those years, participation has not returned to pre-2010 levels.
MHSAA Bulletins 2001–2007MHSAA participation reports 2007–2021MHSAA 2021–222022–232023–242024–252025–262018–19 via MLive
Players per high-school program
MHSAA Bulletin, Aug. 2001MHSAA 2025–26
MHSAA Bulletin, Aug. 2001MHSAA 2025–26
Schools offering baseball increased about 3% while participation fell about 19%. Baseball isn't losing schools. It's losing players. More programs are serving fewer players — even as the youth system beneath them has never been bigger.
"They didn't quit. They just went to travel."
It's the most common explanation for the decline: high-school-age players are skipping the school team for travel baseball and its college exposure. In Michigan, the rules make that an unusual trade. Under MHSAA eligibility rules, once a student practices with a high-school team, he "cannot participate in any athletic competition not sponsored by his or her school in the same sport in the same season." High-school baseball owns the spring. Travel and showcase baseball happen around it, in the summer and fall — for most players, in addition to the school team, not instead of it.
Michigan's high-school athletes also aren't narrowing the way the "they all specialized" story assumes. In 2025–26, 45.3% of athletes at MHSAA member high schools played two or more sports — and in smaller Class C and D schools, most did.
MHSAA Multi-Sport Survey, 2025–26
And the research on why kids stop playing points somewhere else entirely. They aren't moving up. Many are moving out.
Michigan kids say the same thing in their own words. In Aspen's State of Play report on Southeast Michigan, students described a system where "by middle school, kids have been playing for years, and if you don't play, it's hard to start," and where they felt expected to already be good at a sport just to join. One Detroit student's advice: "Stop putting so much pressure on kids so that more kids will want to play."
State of Play: Southeast Michigan
In Project Play's national parent survey, the most common reason a child discontinued a sport (36% of the time) was that they stopped enjoying it or lost interest. Switching to another sport accounted for only 15%. The average child quits a sport by age 11, after less than three years.
Project Play / Utah State, 2019
Why former players say they left
The top reason former players give — "I'm not good enough" — is exactly what a disappearing on-ramp would produce. Project Play has found that in some communities, kids without proper skill development at younger ages "face long odds to make their high school team," and that early specialization is causing some kids to "prematurely 'retire'" from sports.
Nationally, baseball participation falls from 11.7% of kids ages 6–12 to 8.8% of teens ages 13–17. Those teens aren't all on travel rosters. Many of them just aren't playing anymore.
Project Play 2024 data via Youth Sports Business Report
You can start track at 14. Can you start baseball?
The developmental window has moved earlier — and the door for late starters has narrowed.
Different youth-sports structures are producing very different participation outcomes. Michigan boys track and field is setting participation records while baseball, basketball and football remain well below their early-2000s levels.
MHSAA 2025–26: track recordMHSAA 2024–25: track record
A 14-year-old can decide, "I'm going to try track," and plausibly join his school team. It's increasingly difficult to decide at 14, "I'm going to start playing competitive baseball." The developmental pathway has moved earlier. Call it the disappearing on-ramp.
Nobody is doing anything wrong. That's the problem.
Every decision makes sense. Together, they shrink the game.
The easy version of this story blames someone: pushy parents, greedy tournament operators, lazy rec leagues. The research doesn't support any of them. Every group in youth baseball is responding sensibly to the incentives in front of it — and the incentives all point the same direction.
Families follow the best coaching. Volunteer coaches follow their own kids. Rec boards cut what they can't staff. High-school coaches are barred by rule from running their own development programs for most of the year. And a private market fills every gap the public system leaves — at a price. None of those decisions is irrational. Together they form a loop.
How the loop actually works
Who the loop leaves behind
The loop doesn't hurt the kids it's designed around. The strongest 10-year-olds find travel teams, good coaching and plenty of games. The kids it loses are the ones in between: the average 11-year-old, the late bloomer, the kid whose family can't or won't buy the full package. They're not pushed out by any one decision. They're left behind by all of them — at exactly the ages, 12 to 14, when Aspen's national youth survey finds a third of all quitting happens.
Aspen National Survey of Youth and Sports, 2026
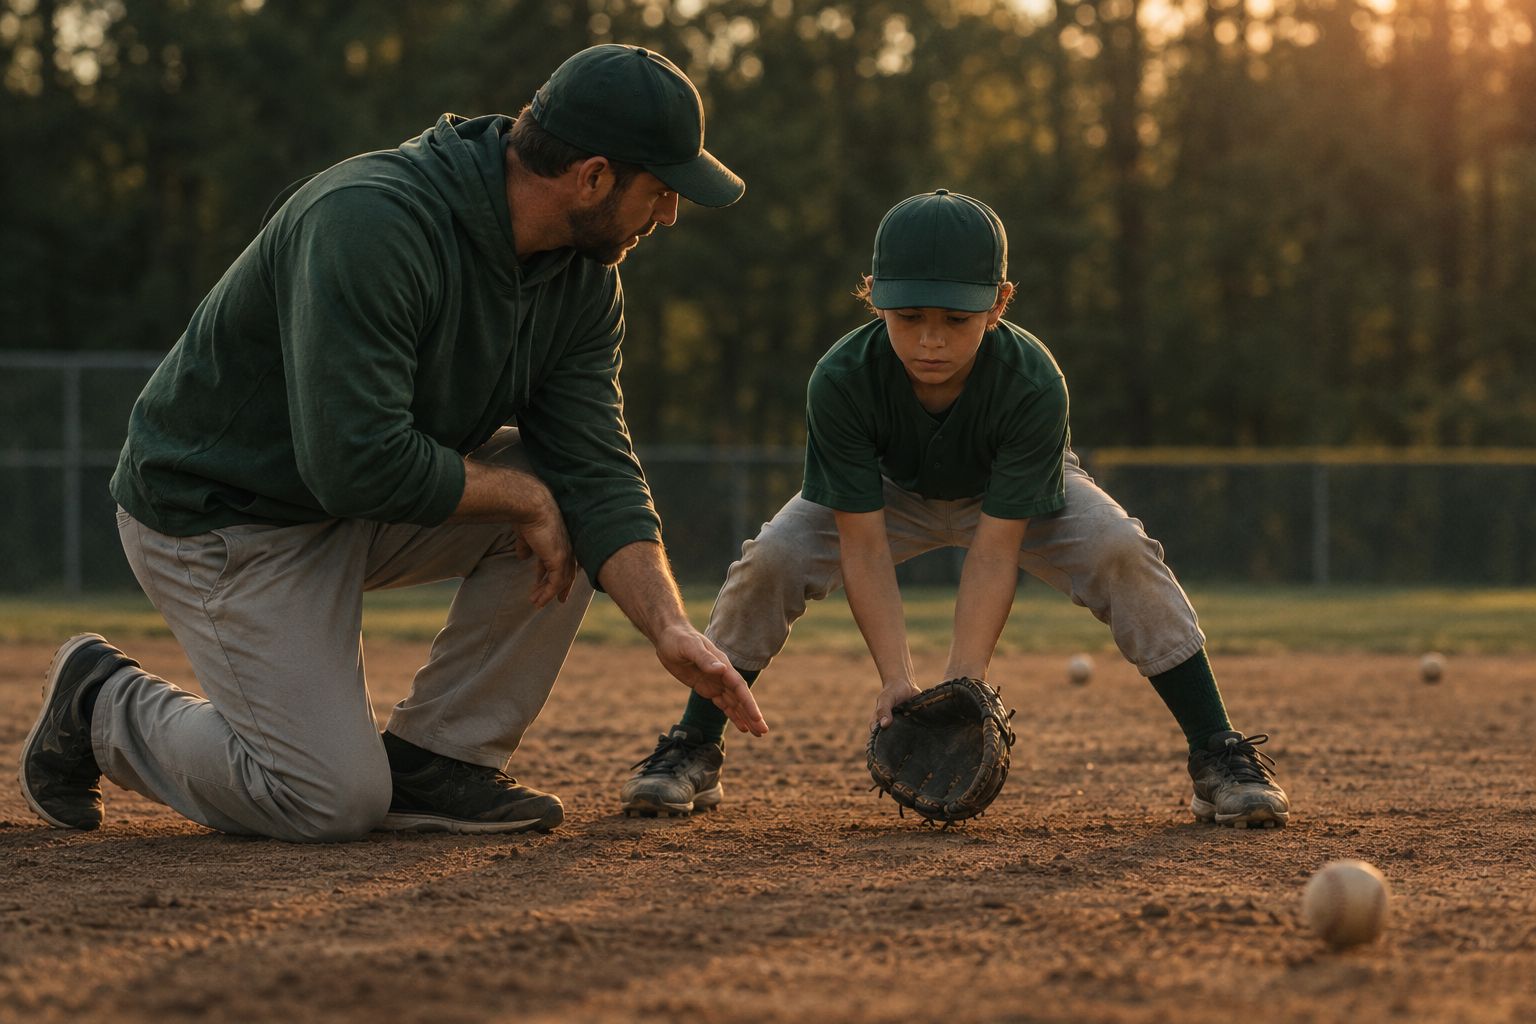
Rebuilding the middle.
The answer isn't less baseball. It's a better middle.
Travel baseball should keep serving the families who want it. Traditional rec should keep providing accessible entry-level play. What's missing is something between them. The Farm League isn't an advertisement dropped into a research paper — it's a design response to the evidence.
Recreation
Entry & participation
← The Missing Middle →
Development & competition
Travel
Elite competition & tournament travel
The real cost of competitive baseball.
The costs that never show up on a team invoice.
Project Play's 2024 parent survey found the average family spent $1,016 on a child's primary sport, and nearly $1,500 once other sports were counted. The spread is the story: youth sports now runs from free to the price of a used car, and baseball sits at the expensive end. It was the costliest of the three most-played youth sports.
Baseball's 68% rise wasn't driven by one line item. Project Play found baseball parents outspent soccer and basketball parents in four specific places: registration, travel and lodging, private lessons, and camps. Every one of those is a category that grows as a player moves deeper into the competitive system.
The cost iceberg
Bat Digest parent survey, 2023Project Play spending categories
The team fee is the number families compare. It's rarely the number they end up paying. The biggest drivers Project Play identifies — travel and lodging for non-local play, individual camps, and private instruction — sit outside the fee entirely.
Who gets priced out
Cost doesn't just shape how kids play. It shapes whether they play. According to Project Play, the wealthiest families spend about four times more on a child's sport than the lowest-income families, and families earning $150,000 or more spend 83% more on sports travel than those under $50,000. Half of Americans who played youth sports or had kids who did said they struggled to afford it.
Project Play: youth sports challenges
Project Play, Feb. 2025State of Play 2022
And kids notice. Project Play's youth surveys increasingly show children saying what they dislike most about sports is that it's "too expensive." One student told The New York Times his former team cost $500 to $700 a month.
Project Play: 10 trends to watch
How to read this report.
Every claim is labeled by its evidentiary weight.
Original analysis
Farm League counts of TPX-ranked Michigan teams (2026) and USSSA Michigan rankings of all registered 8U–12U teams (2010).TPX Rankings
Supported inference
Patterns consistent with data, such as progressive travel entry by age.TPXSE Michigan
More teams · More tournaments · More training · More spending
Fewer Michigan high-school baseball players than 25 years ago.
Maybe youth baseball doesn't need another tournament.
Maybe it needs a better place to play baseball.
Bring Baseball
Back Home.

Join the Farm League interest list